In layman’s terms, infographics are basically a creative way to make data and charts pleasing to the eye.
An infographic may consist of creatively done colored charts and images. The data is presented almost as art, rather than lines and lines of boring text, and usually focus on one main point or theme. They have become a creative alternative to traditional spread sheets, and have gained great popularity in social media outlets.
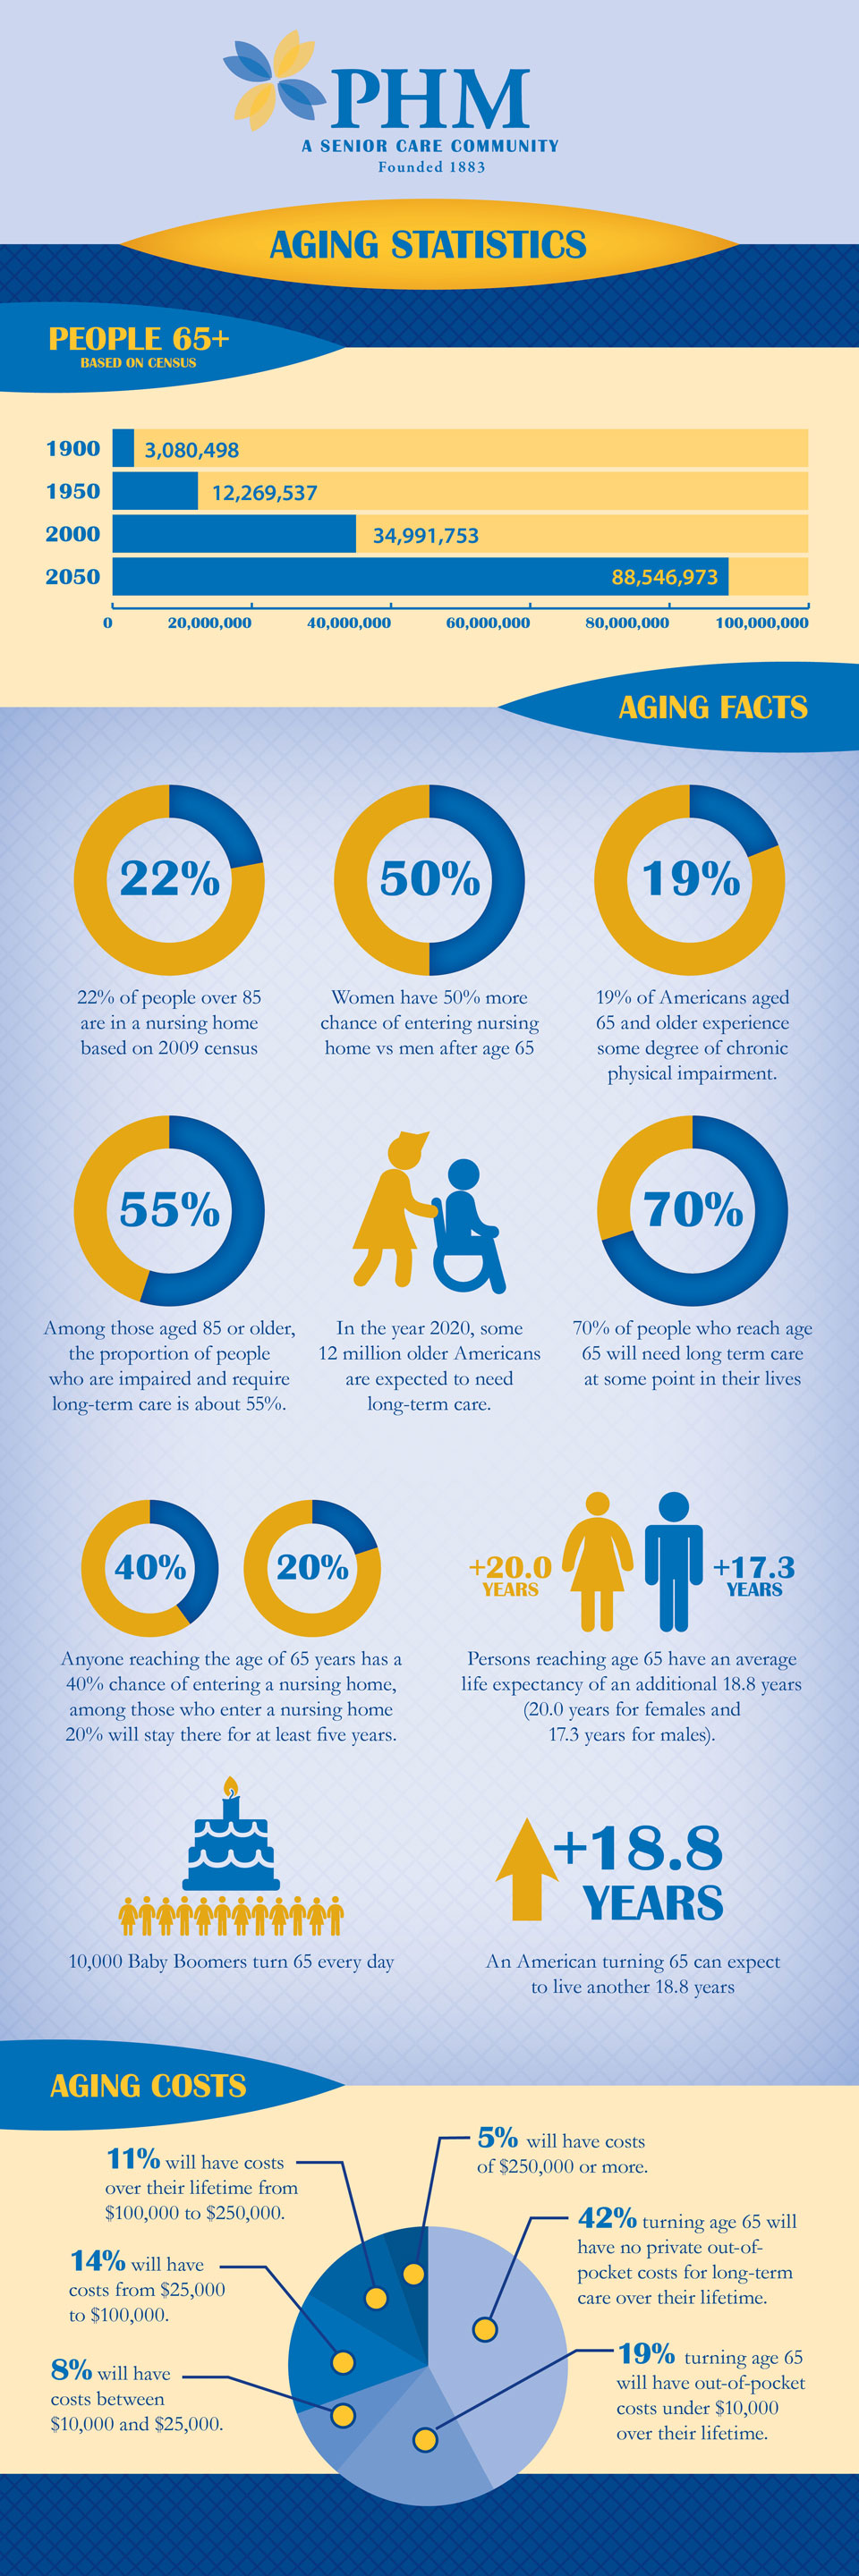
Infographics can be for anything really. I’ve seen infographics describe Super Hero Powers, the Benefits of Exercise, the History of Bicycles, and even one for World Octopus Day. Now, doesn’t that sound better than looking at a traditional spread sheet?
Let’s face it, spread sheets, no matter how organized they are can be overwhelming, if not just plain scary. I for one am not a numbers person and normally get lost after a few seconds. I love the idea of infographics and that they can make information, which people wouldn’t normally read, be something fun to learn about.
Presenting data in small bursts, which is easy to look at, is very beneficial. Whether you are an accountant sharing your investment data, a teacher who’s describing the four food groups, or a salesman trying to describe the marketplace, infographics may be something to look into. The benefits of using infographics include having a higher impact, they make the data easier and simpler to read, they are sharable, and they can be memorable and go viral.
Recent Comments